M4 Master LCvd  

Team

  • Emily Gilbert
  • Fatlind Krasniqi
  • Linda Fernsel
  • Paula Osterkamp
  • Shari Eichberger

Supervision

David Koschnick, Matthias Daiber

Symptom Tracker

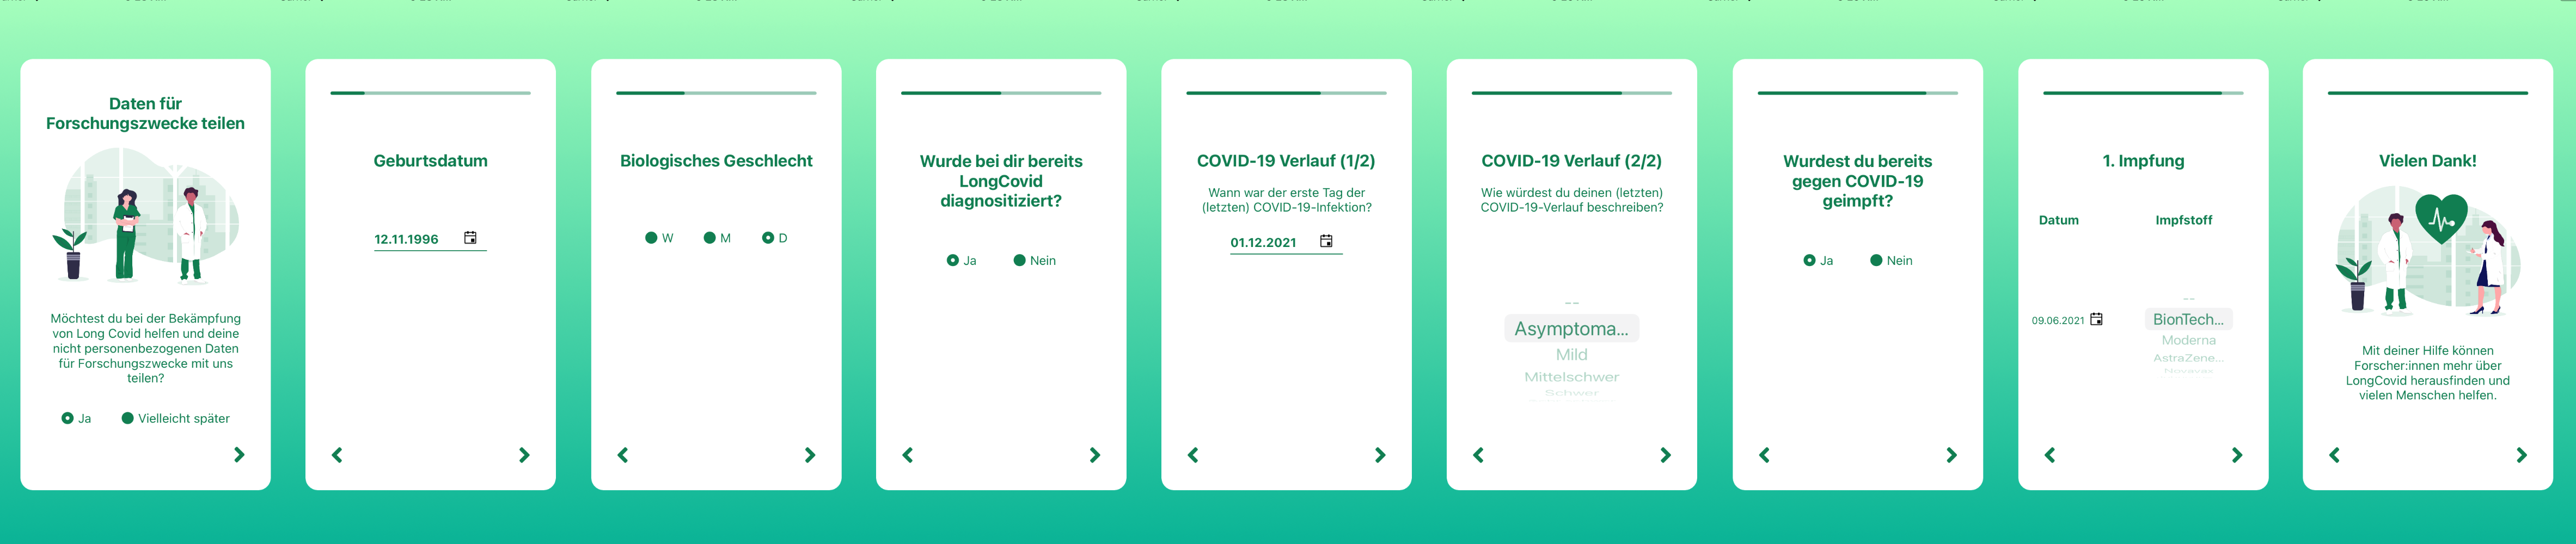
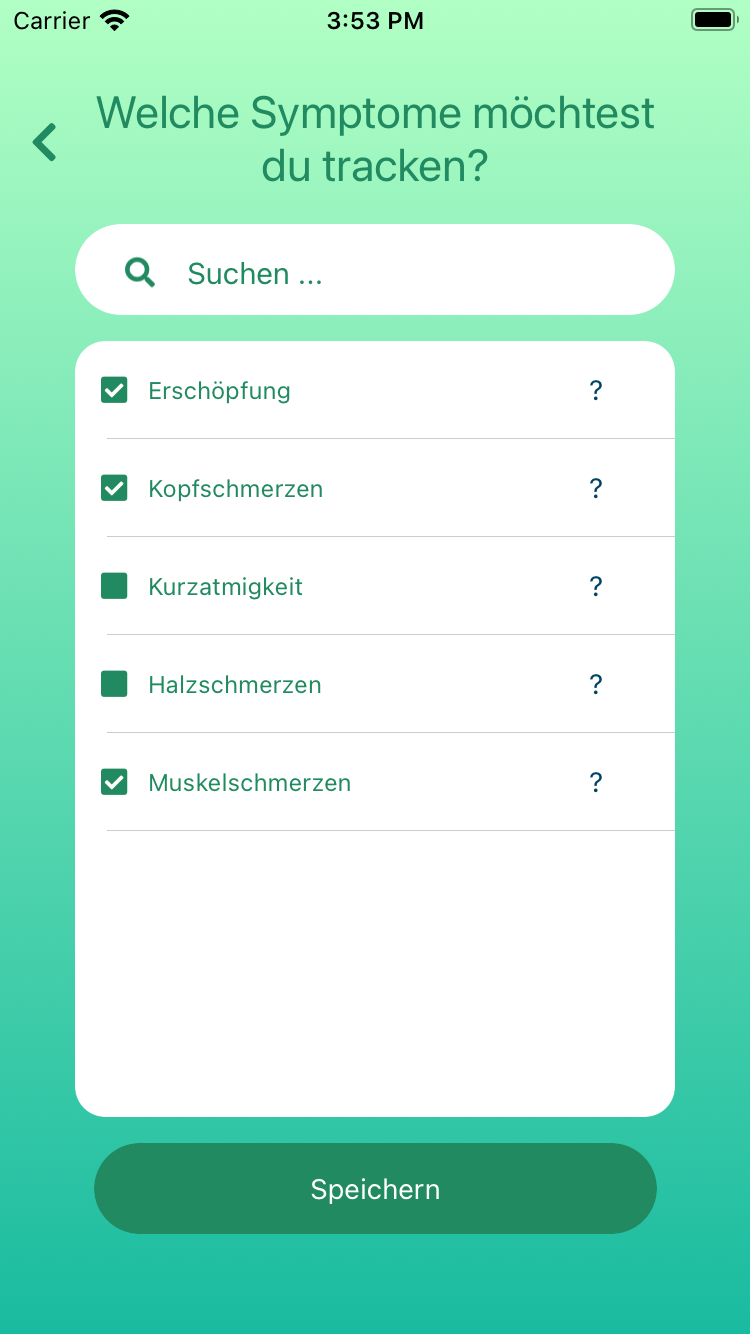
With LCvd’s symptom tracking feature, people who have recovered from COVID-19 can note down their condition on a daily basis. Because there are many possible symptoms, users can select which symptoms to track and update their choice if needed.

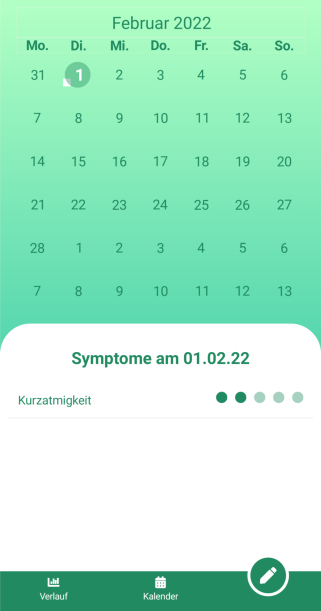
New records can be added either in the calendar or graph view, using the plus-button. Records can be edited afterwards using the pen-button.

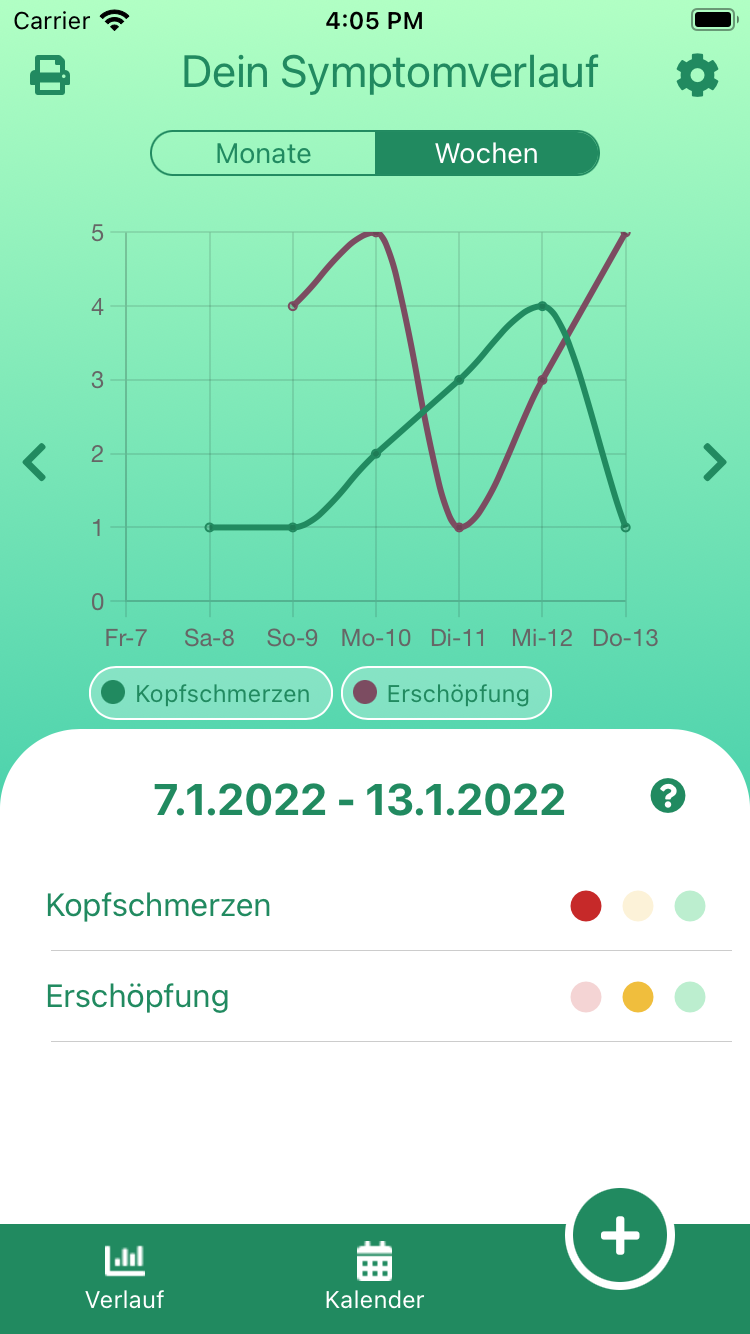
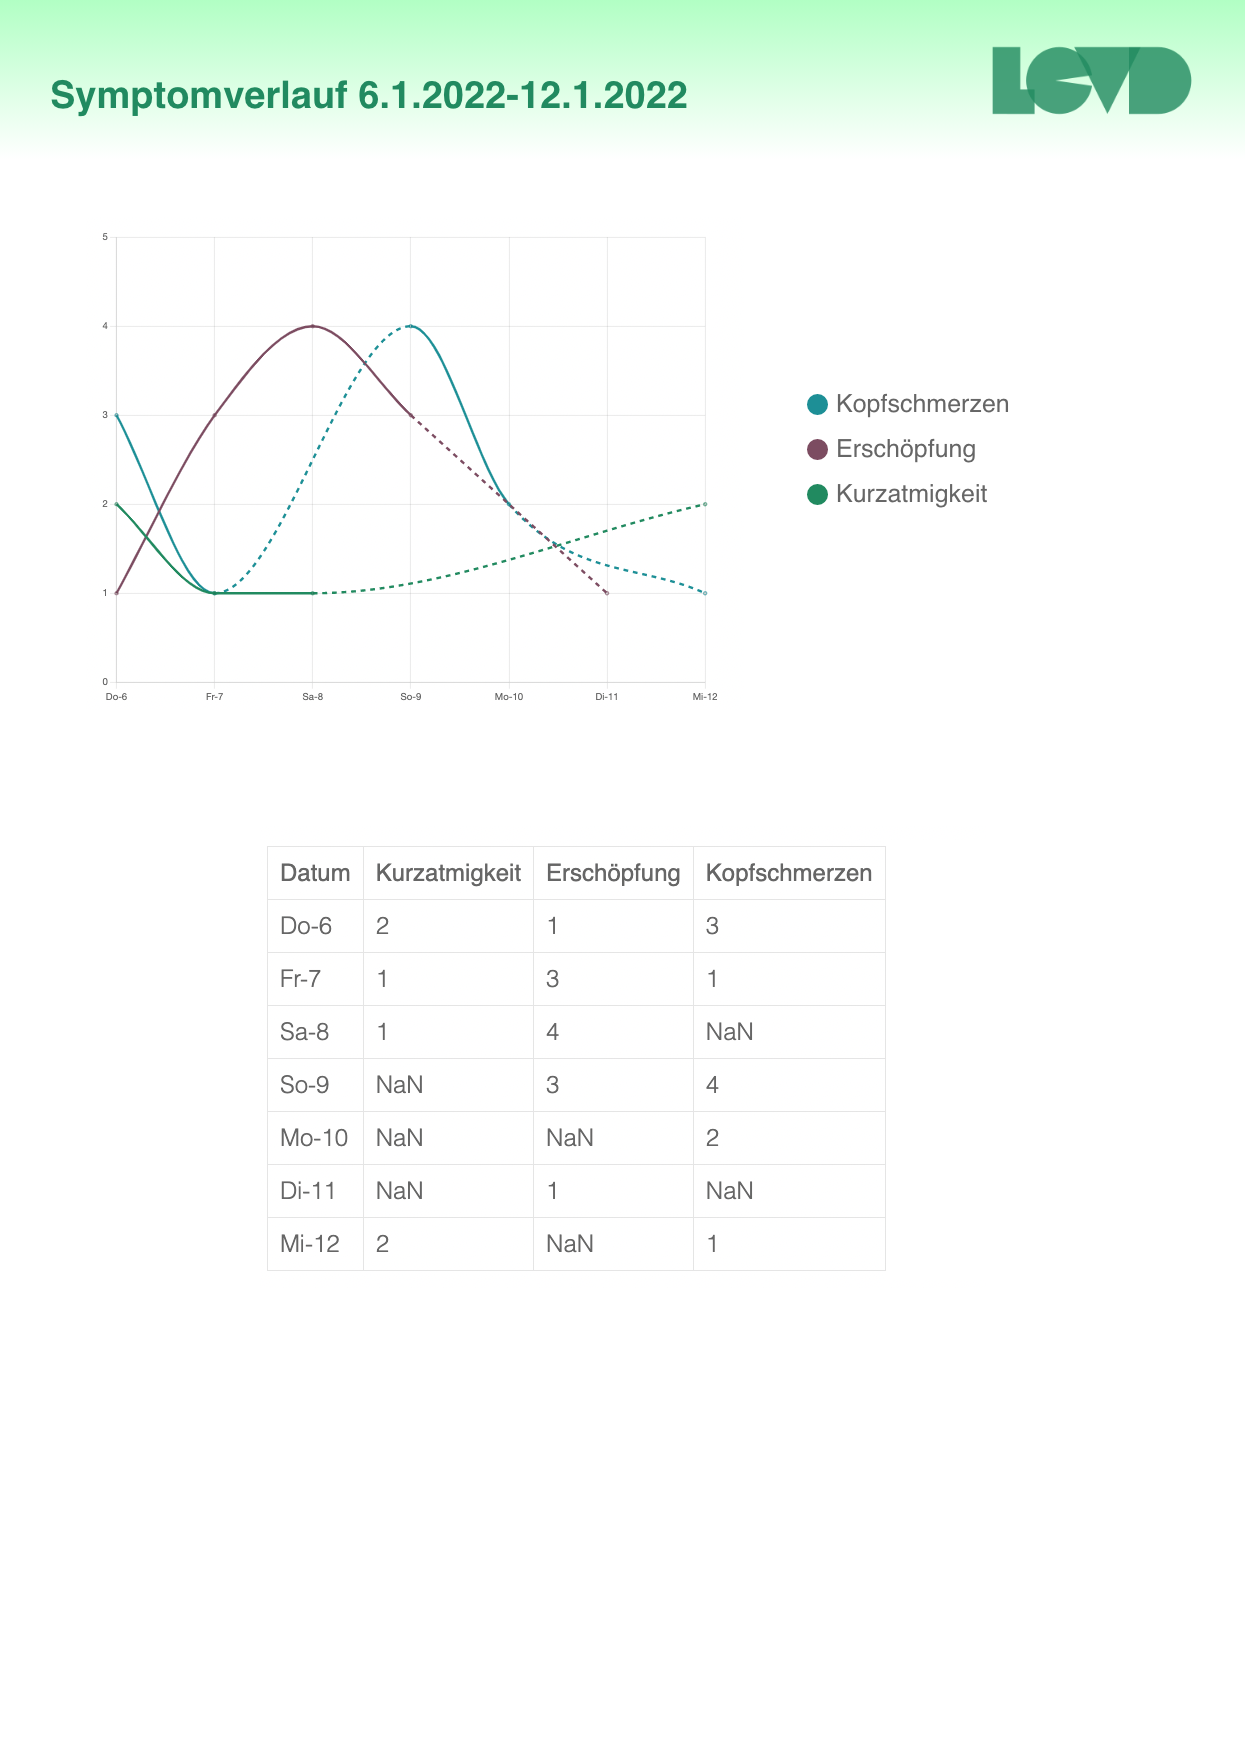
In the tracker view, users can estimate how strong a symbol is, from a scale from 0 (no symptom) to 5. When the tracker view is open, one can switch between dates and quickly navigate to today’s date.

Symptom Information

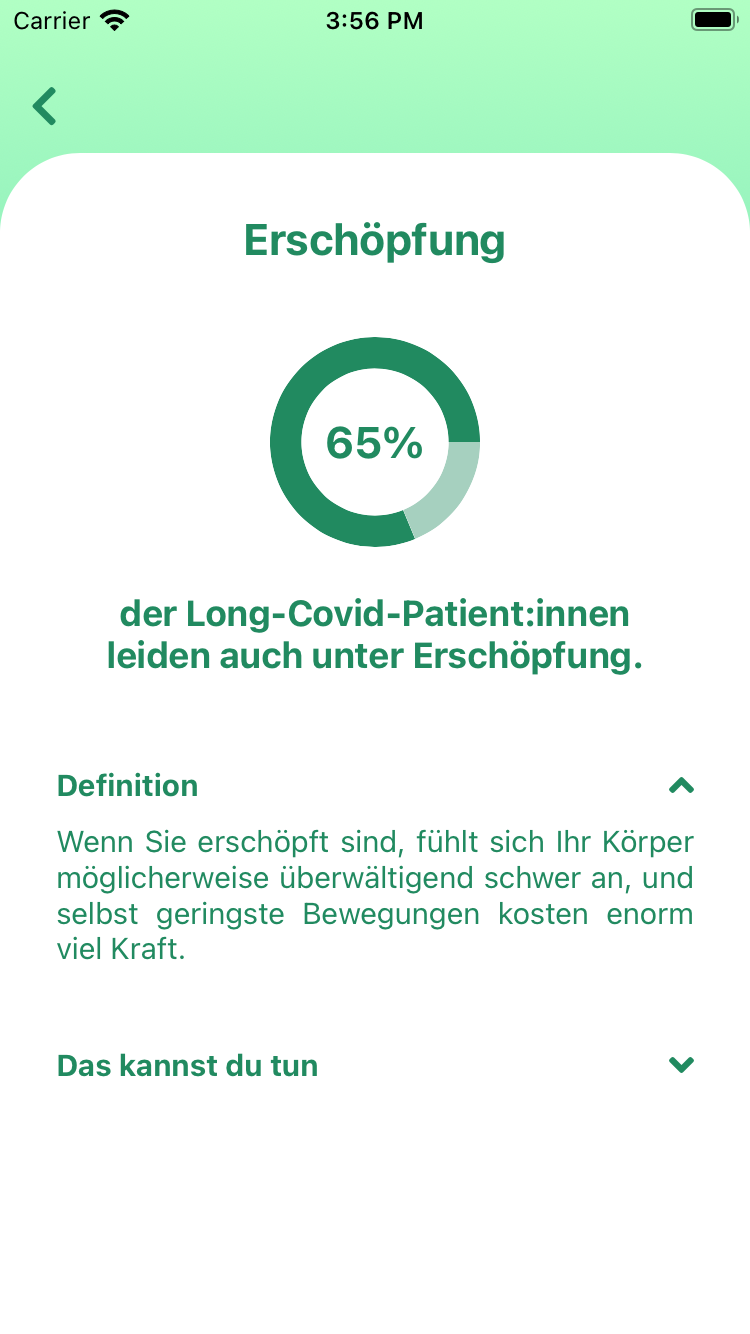
To help patients understand their symptoms and learn what to do about them, we provide them with short explanations. All our information needs to be based on scientific sources. One of the sources we currently use is the brochure “Empfehlungen zur Unterstützung einer selbstständigen Rehabilitation nach COVID-19-bedingter Erkrankung”, second edition, published by the WHO Regionalbüro für Europa in 2021.

To show patients that they are not alone we added a pie chart on which percentage of other Long Covid patients have been affected by a symptom in the course of their Long Covid illness. This feature does not contain meaningful data yet.

The symptom information can be reached when clicking the question mark in the tracker view.

A short version of the symptom information is displayed when the question mark in the symptoms-to-be-tracked selection view is clicked.

Symptom Visualization

LCvd’s visualization of symptom development can support people without a diagnosis in deciding whether getting checked for Long COVID might make sense. If someone has already been diagnosed with Long COVID and is keeping track of their symptoms via LCvd, the app’s visualization helps them understand the course of their illness.

Calendar

A calendar shows for which days the symptom strength has been recorded. One can switch between months by swiping. One can select a day and can then either see the record for that day or be prompted to track symptom strength for that day.

Graph

A line graph displays the course of symptom strength for each individual symptom. If multiple symptoms are being tracked, symptom curves can be turned on and off. The graph can be displayed per week or per month and it is possible to switch between periods of time.

“Symptom Light”

LCvd’s “symptom light” or “symptom traffic light” (“Symptomampel”) is shown under the graph representation of the symptom strength curve. It helps people with Long Covid decide whether another visit to the doctor is necessary. The “symptom light”’s color is based on the growth rate of a symptom’s strength over either a week or a month, depending on which period of time has been selected in the graph view. If the symptom is getting stronger, the light switches to red. If it gets better, it switches to green. If the symptom strength stays the same, the light switches to yellow. Internally, we calculate the growth rate with linear regression.

For clarity the user is provided with an explanation of the “symptom light”, when clicking on the question mark.

PDF

LCvd’s ability to create a PDF with symptom records can provide extra insights for doctors.

Registration and Authentication

Users can register and then login with an email and password. JSON Web Token is used in the backend to enable token based authentication.

Settings

In the settings users can change their email and password. They can enable or disable daily push notifications that remind them to track their symptoms. They can also choose to share their data for Long COVID research and enter additional data.

Additional Data Entry

If users are willing to help Long COVID research they can enter additional information about their age, infection and their vaccinations. Every question is optional and can be skipped. The timeline at the top indicates the progress they have made when entering their details.

Views for entering additional data for research